
Optical data
Optical sensors measure the reflectance from the Earth’s surface. As snow on ground is very bright, it has a strong signature and is thus “easy” to detect (e.g., Gascoin et al., 2015).
However, snow on ground is not directly linked to the rain/snow limit, because snow evolves as a function of multiple processes and melts. As it is not possible to observe snow during its deposition, due to clouds obscuring the scene, we can only observe it the following day.
Within the iFROG project, we will compare the altitudinal distribution of the snow observed by optical satellites (Sentinel-2, MODIS, Landsat) to bright band heights detected by precipitation radars.
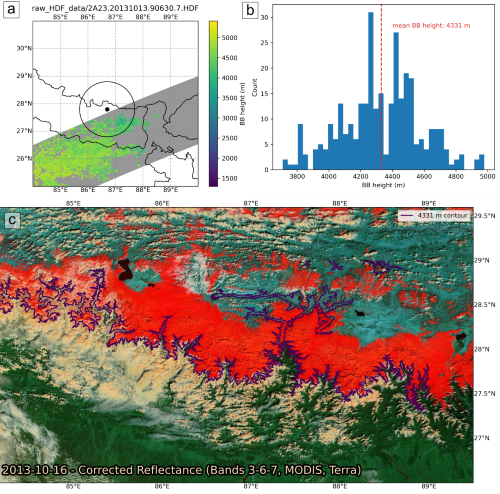
Fig. - a- Map of bright band height from TRMM satellite, the grey area shows the satellite swath where no data is retrieved because of the ground clutter or the absence of clouds. The black dot is the Everest summit and the circle is a one degree radius circle, b- distribution of the bright band height measured within 1 one degree from the summit of Everest and c- false color composite from MODIS taken on 16 October 2013, the snow is shown in red, the clouds in orange, the forest in green and the bare land in green/blue. Also shown is the 4331 m contour, corresponding to the mean bright band height measured by TRMM.
Gascoin, S., Hagolle, O., Huc, M., Jarlan, L., Dejoux, J.-F., Szczypta, C., Marti, R., and Sánchez, R.: A snow cover climatology for the Pyrenees from MODIS snow products, Hydrol. Earth Syst. Sci., 19, 2337–2351, https://doi.org/10.5194/hess-19-2337-2015, 2015.
Updated on 23 May 2022
